Stephen (Pluckin Penguin, a.k.a. Donut Delight) is a S7 Master-tier jungle main and captain of the NC State Varsity League of Legends team, which recently qualified for the Collegiate Championship. He will be competing in the tournament from May 23rd to May 26th in Los Angeles.
This article is accompanied by a tool and a video walkthrough. Click to check them out!
Where do elite junglers go? This question gnawed away at us. Unlike other roles, which are mostly relegated to their lanes, junglers must assess many variables on the spot in order to come up with a path to fit the state of the game:
- Jungle status: Which camps are up or respawning shortly?
- Champion and team: When is my champion the strongest? How fast does my champion clear? What is my team’s win condition, and how should I play around this?
- Match up: Where is the enemy jungler? Who wins 1 vs 1? What is the opposing team’s win condition, and how may the enemy jungler play towards this?
- Lanes: Are the enemy laners in a position for me to gank? Are my laners in a position for me to counter-gank? Are my laners pressuring hard enough for me to invade or tower-dive? Are my laners pressured hard enough that I should be wary of an invade or tower-dive?
- Objectives: Is dragon alive or respawning soon? If so, which elemental dragon is it? Has the first turret gone down? If not, are any towers, friendly or enemy, nearly destroyed?
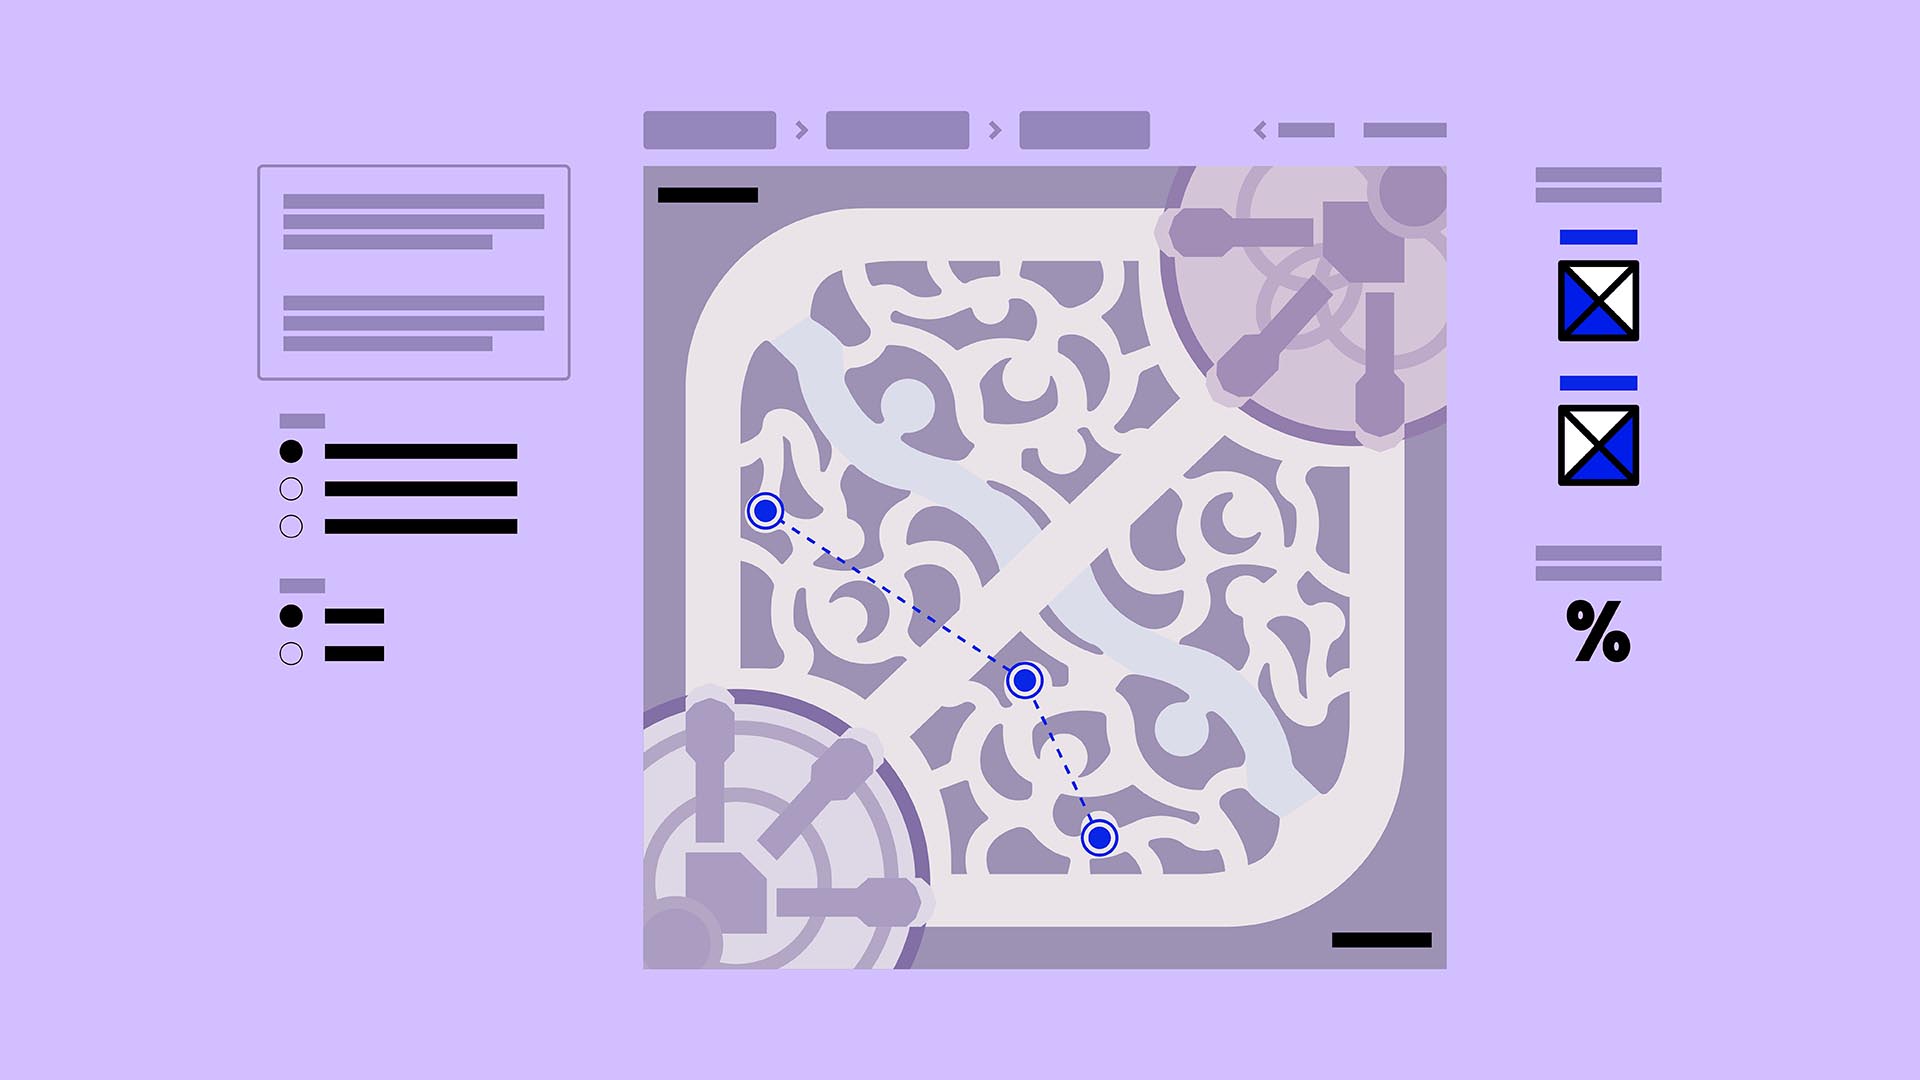
All of these variables have a notable impact on jungle pathing, which makes an analysis of jungling both challenging and potentially rewarding. That’s what inspired us to create the Choose Your Path jungle tool, using data science and large amounts of high-elo jungling data in order to present new insights into the patterns of elite jungling.
Because jungle pathing is so contextual, we decided to focus on early game jungle pathing, restricted to the first six minutes of the game. During this time, the game state is fairly consistent which means the variables above play a smaller role, making it easier to identify the patterns in common jungle routes only by looking at position data.
Creating the Tool
Getting Started
Imagine trying to develop an understanding of where junglers are at three minutes. Here is a plot of 3-minute positions for junglers on blue side:
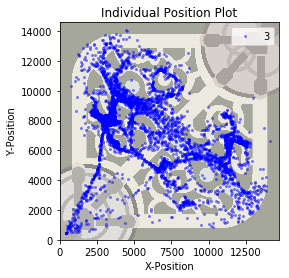
Individual position plot for a random sample of ALL blue team jungler positions at 3:00.
Unfortunately, there’s not much we can learn from this plot. A jungler’s position at three minutes doesn’t tell us much if we don’t know how they got there.
Based on this understanding, we refined our initial question to: “given a jungler’s path so far, where will they go next?” To answer this, we turned to statistics and machine learning for help. The essential idea was: to figure out where a jungler will go next, look at other players that took a similar path to the jungler, and see where they went next.
Data
We used the Riot Games API to gather the match timeline data from all of the games on patches 9.1 and 9.2. This data includes an x- and y-coordinate for every champion in a game in one minute intervals. Since we wanted to focus on high-level gameplay, we filtered the data to only include games that were diamond-average or better, which gave us nearly 200,000 games to work with. We filtered the data further to only include the jungler’s x- and y-coordinates for the first six minutes of every game since we were focused on early-game jungle pathing.
Path Comparison
Now that we had 200,000 games to work with, we needed to determine a way to define whether two paths were similar, so that we could use similar paths to predict a jungler’s next location. We tried a few methods of path comparison and ended up using a simple version of a statistical technique called kernel density estimation. Given positions for two paths, our method calculates the distance between the jungler position in the two paths at each minute. In order for two paths to be considered similar to each other, every single position along the first path would need to be close enough, within 750 units in-game, to their corresponding position in the second path. However, if any position along the two paths were not close enough, then the paths were deemed to be dissimilar. Here are two examples of path comparisons:
| Minute | Position | Distance | Close Enough? (Distance < 750) | |
|---|---|---|---|---|
| Path 1 | Path 2 | |||
| 2 | (8375, 2375) | (8117, 2445) | 267.33 | ✔ |
| 3 | (4375, 9500) | (5018, 9344) | 661.65 | ✔ |
| 4 | (2250, 8375) | (2388, 8386) | 138.44 | ✔ |
| Minute | Position | Distance | Close Enough? (Distance < 750) | |
|---|---|---|---|---|
| Path 1 | Path 3 | |||
| 2 | (8375, 2375) | (8001, 2280) | 385.88 | ✔ |
| 3 | (4375, 9500) | (4417, 9335) | 170.26 | ✔ |
| 4 | (2250, 8375) | (4102, 7297) | 2142.89 | ✘ |
With our path comparison method finalized, we created three different ways to visualize similar paths: individual position plots, positional heat maps, and win rate heat maps.
Visualizations
Individual Position Plot
The individual position plots points pertaining to each jungler’s minute positions. To create this plot, we first compared the current path to the paths in our database and selected all paths that were similar to the current path. After that was done, we plotted the next-minute positions from the selected paths alongside the user’s current path, as shown in the screenshot below.
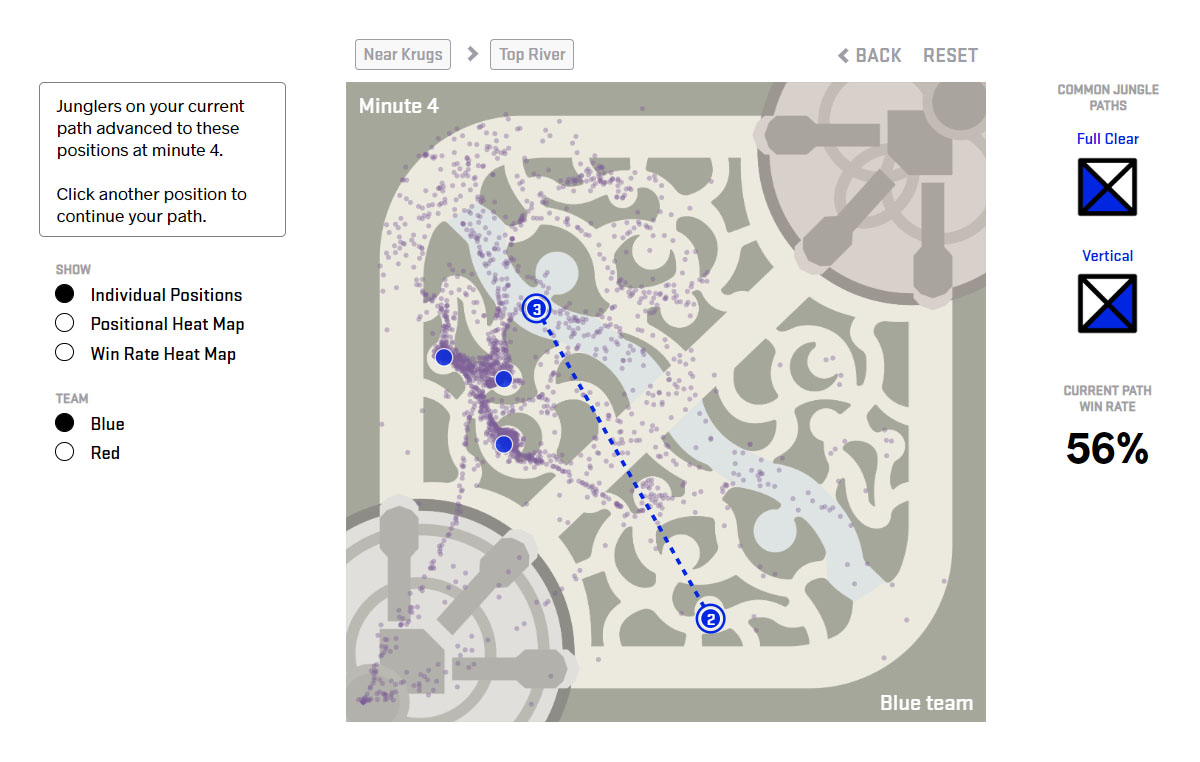
Individual position plot where the blue team jungler’s path is krugs at 2:00 and top river at 3:00.
Positional Heat Map
The positional heat map displays regions of jungler concentration in order to make it easier to compare regions with high numbers of junglers. To create this heat map, we divided Summoner’s Rift into regions with a 30x30 grid, and, instead of plotting the all next-minute positions as we did in the position plot, we counted the number of next-minute positions that belonged to each region of the map. The total count of each region in the positional heat map divided by the total count for all regions was used to determine the concentration of junglers at the next minute.
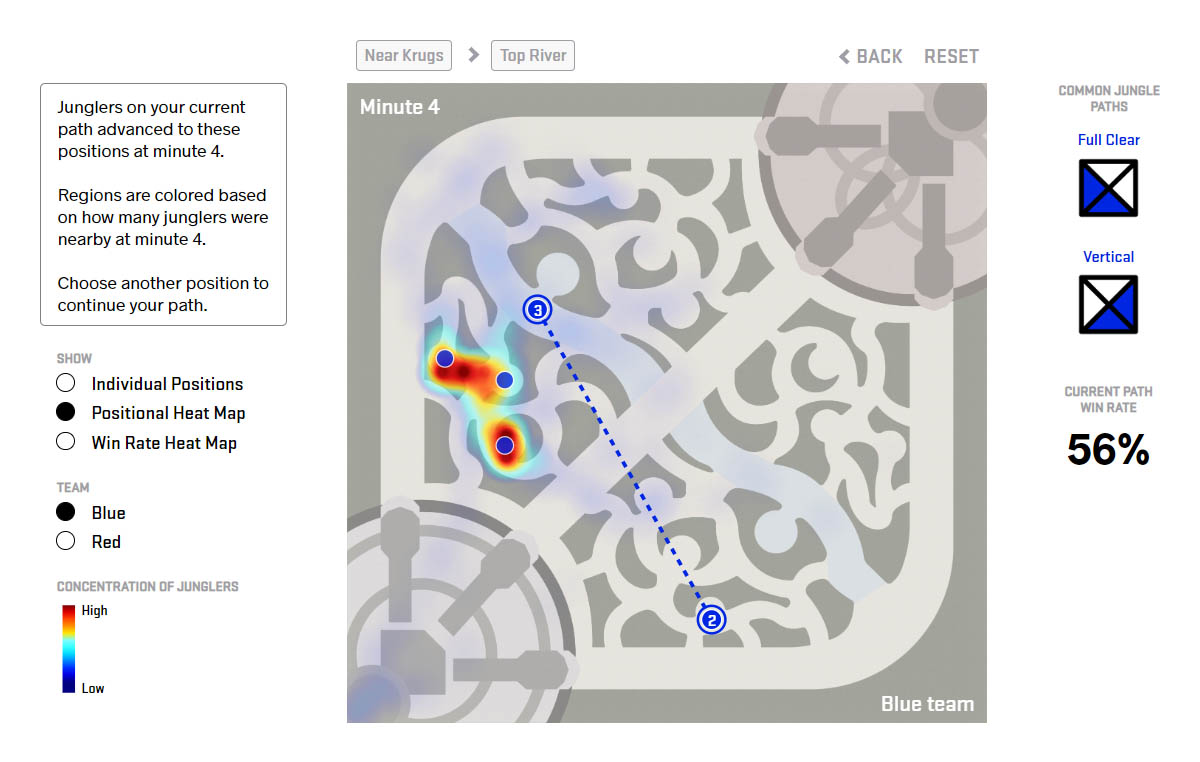
Positional heat map where the blue team jungler’s path is krugs at 2:00 and top river at 3:00. The colored regions are indicative of the frequency of junglers at 4:00.
Win Rate Heat Map
The win rate heat map displays how the junglers’ win rates fluctuate depending on their location at the next minute. To create the win rate heatmap, we used the 30x30 Summoner’s Rift and counted the number of wins and total number of games in each cell of the grid. We then calculated the win rate, number of wins divided by number of games, in each cell of the grid, but we encountered an issue: low sample size regions.
There were many regions with only one or two junglers, which meant they would often have extreme winrates like 0% or 100% (if 0/2 or 2/2 of the junglers in a region went on to win, for example). We did not want any region of the map to be assigned an extremely high or low win rate simply due to this small sample size. To deal with this, we drew some inspiration from Bayesian statistics and ended up calculating the win rate in each region of the heat map using the following formula:

For our data set, we experimented with a variety of values for k, and we ended up settling on a value of 20. In other words, we assumed that every region of the grid already had 40 junglers in it and 20 of these junglers won. This assumption caused the win rates of low sample size regions to get much closer to 50%, but didn’t affect the large sample size regions very much. As a result, the heat map gives a clear visual indication of regions for which there is strong evidence of high or low win rates.
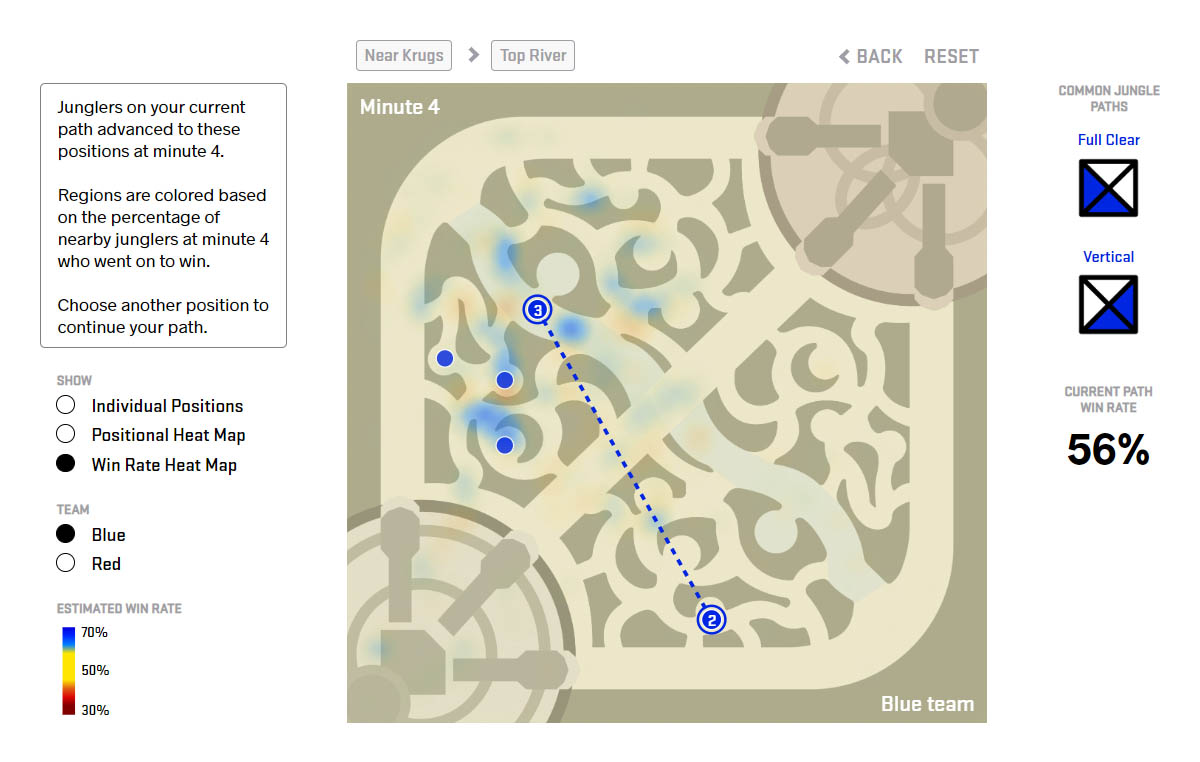
Win rate heat map where the blue team jungler’s path is krugs at 2:00 and top river at 3:00. The colored regions indicate the win rate of junglers that advance to these regions at 4:00.
Closing Thoughts
In the future, there are many more aspects of jungle pathing that we’re interested in exploring. This time, we only looked at games from North America, but it would be fascinating to see how pathing in NA compares to other servers like EU West or Korea. We are also interested in exploring the jungle pathing of specific champions, and how their jungle pathing may be different from the norm. Coming soon, we’ll take a look at one of the most popular junglers across all servers, Lee Sin.
We are eager to continue exploring jungle pathing and are planning to do a follow-up post to capture how pathing has changed with the patch 9.9 changes that delayed the scuttle crab spawn timer from 2:00 to 3:15. If you have any ideas on what you’d like to see next with jungle pathing, please let us know on Twitter or Facebook!

Join in on the fun!
At Doran's Lab, we strive to keep our process transparent and accessible. We've included the data corresponding to this article in a public Github repository for you to download and use.